October 2022 Update
Making The News
The US economy posted its first period of growth in the third quarter, with GDP expanding at an annual rate of 2.6% Q/Q. While the advance has more than offset the decline in the first two quarters of the year, economists are still expecting a mild recession to come as demand continues to be eroded away by high inflation and rising interest rates.
Chinese President Xi Jinping secured his third term as president in October and introduced a new leadership team sharing alike views. This has raised concerns regarding what stance he will take towards the private sector, as many worry that he could introduce policies that will further hamper growth.
The political instability in the UK continued in October. Jeremy Hunt, the new finance minister, scrapped Prime Minister Liz Truss’s economic plan to fund tax cuts with increased debt, given that the UK is currently dealing with a large current account deficit, a weakening currency, high inflation, and a looming recession. This subsequently forced Truss to step down and make way for Rishi Sunak to take control.
Intensifying loadshedding remains a concern for the South African economy. Additionally, the reliance on commodity exports to China is also likely to hurt economic growth as the Chinese economy slows. As a result, the National Treasury revised the GDP growth forecast for 2022 to 1.9% from 2.1%.
Below are key takeaways from the MTBPS tabled in October:
- The main budget deficit in 2022/23 has been revised notably lower to 4.9% of GDP from 6.0% expected at the time of the February budget.
- The improved tax receipts, particularly from corporates, resulted in higher revenue collection from the government and this is expected to exceed non-interest government expenditure for the first time in 15 years from 2023/24. This facilitates a move to a primary budget surplus of 0.7% of GDP next year.
- The gross debt-to-GDP ratio is projected to peak at 71.4% in 2022/23, easing gradually to 70% in 2025/26 and continuing a steady downward trajectory to 63% in 2030/31.
Market Commentary

After a bumpy start, asset classes across the board rebounded strongly in October except for Emerging Market Equity (MSCI EM). The US Dollar remained strong throughout the month (up +2.3% against the Rand) keeping it’s “safe haven” status.
The FTSE/JSE All Share Index were up +4.9% in October and remains positive for the year (up +3.3%). The MSCI World Index were up strongly +9.6% for the month but still negative for the year (-1.4%) lagging local equity. Emerging Market Equity (MSCI EM) struggled throughout the month mainly due to China’s underperformance driven by real estate sector stress, a rise in covid cases as well as the outcome of the presidential election causing uncertainty about their economic future.
The biggest surprise of the month was SA Listed Property (SAPY) up +11.0% on the back of heavy loadshedding throughout the month. Global Property (FTSE EPRA/NAREIT) up +4.4% was a breath of fresh air considering the struggle year-to-date.
Impact on CWM ModelPortfolios


The local CWM model range has an average overweight to growth assets (Equities + Listed Properties) of +9.5% – a certain advantage in a month where the prevailing market sentiment was “risk-on”. While the models generally display a slight skew towards Value equities, in the cases where the Value style was most pronounced (Retirement Growth, Flexible, RI-Growth), the models also outperformed peers by the largest margin. Another contributor across the board was an underweight to the Tech sector (FTSE/JSE Industry/Technology index down –15.6%). Again, the models that displayed the largest underweight to the sector (Retirement Growth, Flexible, RI-Growth) were the ones that outperformed most.
For the Global USD models, the average growth asset exposure was broadly in-line with peers over the course of the month. The outperformance, therefore, was not linked to asset allocation, but rather to sizable overweight’s to Value equities (+6.4%) and the Energy sector (+11.0%) – both of which enjoyed double-digit returns in the month. In addition, CWM Global Growth benefitted from an underweight to EM Equity (China Equity in particular) and the highest allocation to the month’s top performing fund within the full CWM range (local & global) – the Ninety One Global Natural Resources fund (+12.3% in USD).
While the month’s excellent performance is welcomed, we continue to encourage clients to take a longer-term view of their investments, knowing that the short-term is often fraught with volatility. To that end, we prefer referencing the since inception returns of the models, where we are pleased to report positive excess returns across the model range.
Outlook
Despite the geopolitical and economic challenges experienced so far in 2022, financial markets are starting to perform better and there are signs of improvement potentially indicating that markets have been through the worst. We identify three factors for optimism below and whether these factors, in totality, warrant a higher risk appetite in the months and years ahead.
- Downward Pressure on Inflation
A) The correlation between Broad Money Supply and Inflation

Broad money supply tends to lead inflation by roughly two years. The chart above shows the significant surge in money supply in 2020 (which peaked in Feb 2021) and then subsequently came down dramatically to date. If one looks back on the graph between 1972 to 1974, a similar theme played out in which money supply was injected into the economy then shortly withdrawn and two years later, inflation spiked and fell precipitously. We therefore expect inflation to follow suit with broad money supply in the current market environment and the resultant effect is a downward trajectory path in 2023.
B) Peak in Corporate Supply Chains
There have been major improvements in corporate supply chains (e.g., the blue line graph below shows the substantial drop in container costs from Shanghai to Los Angeles). Furthermore, the global supply chain pressure index (i.e., the pink line graph below), which measures delivery times and product costs coming into a factory again, is on a downward trajectory as well. The pandemic caused major supply bottlenecks around the world and now with evidence showing a decline in supply constraints, we expect this to reduce inflation in the coming months.

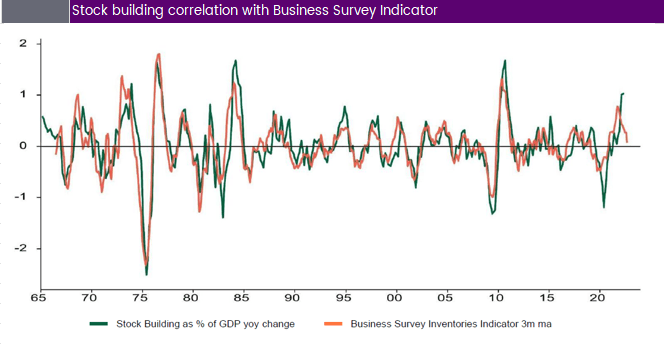
C) Stock building cycle turning down
Because of disruptions to supply chains, businesses have built up stocks as a defense and that has resulted in its percentage to GDP being elevated (i.e., green line below). Current business surveys (i.e., orange line below) indicate that companies will start turning over their excess inventory going forward. Currently, consumer demand is low on the back of higher rates globally and this is expected further ease prices. Important to note the tight correlation between the two variables historically
D) Commodity prices are weakening
Coupled with lower stock building going forward, commodity prices are also coming down. For example, industrial commodity prices (i.e., blue line below) is falling, particularly on weak Chinese demand. Crude oil (i.e., pink line below) is relatively weak despite the supply cuts and really encouraging data is UK Natural Gas prices (i.e., turquoise line below) coming down sharply.

2. Equity valuations are beginning to normalize – dividends & buybacks are attractive
Currently, valuations look more sensible compared to the start of the year for world equities (i.e., bottom left graph now markedly lower than its 20-year average). Other value metrics shown on the graph to the right is forward dividend yields on world equities (i.e., Europe and UK), all above 4%. In the US, if you include very strong company buybacks for a measure of total return, its yield is near the 5% level. The yield support currently reflected in DM markets is attractive and when one looks at the history in the graph, these levels were last seen before 2020.

3. Fund manager sentiment at record bearish levels
Lastly, fund manager sentiment is currently extremely bearish (i.e., bottom left graph). This is a good contrarian indicator as any spark of good news would trigger a robust rally. The graph looks at results from a survey done by Bank of America, in which fund managers were asked how they would rate the potential risks to financial market stability currently. Against high geopolitical uncertainty and monetary risks, the feedback from the survey was more negative (i.e., higher risk) than the recent Covid crisis as well as the Global Financial Crisis in 2008. While we have many challenges today, we do not below the current risks are higher than those previous examples in history. The graph to the right below shows the bull bear spread for US private investors. The graph is almost at maximum bearish level and indicates that good news in the months to come will result in strong equity market performance.

Conclusion
Overall, the factors discussed above lean itself towards a more positive outlook for the next 18 months. At Core Wealth, we remain prudent in our investment approach and have not “bet the farm” on one asset class/style/manager. The CWM models are diversified and have delivered strong excess returns over the last year as well as since inception

